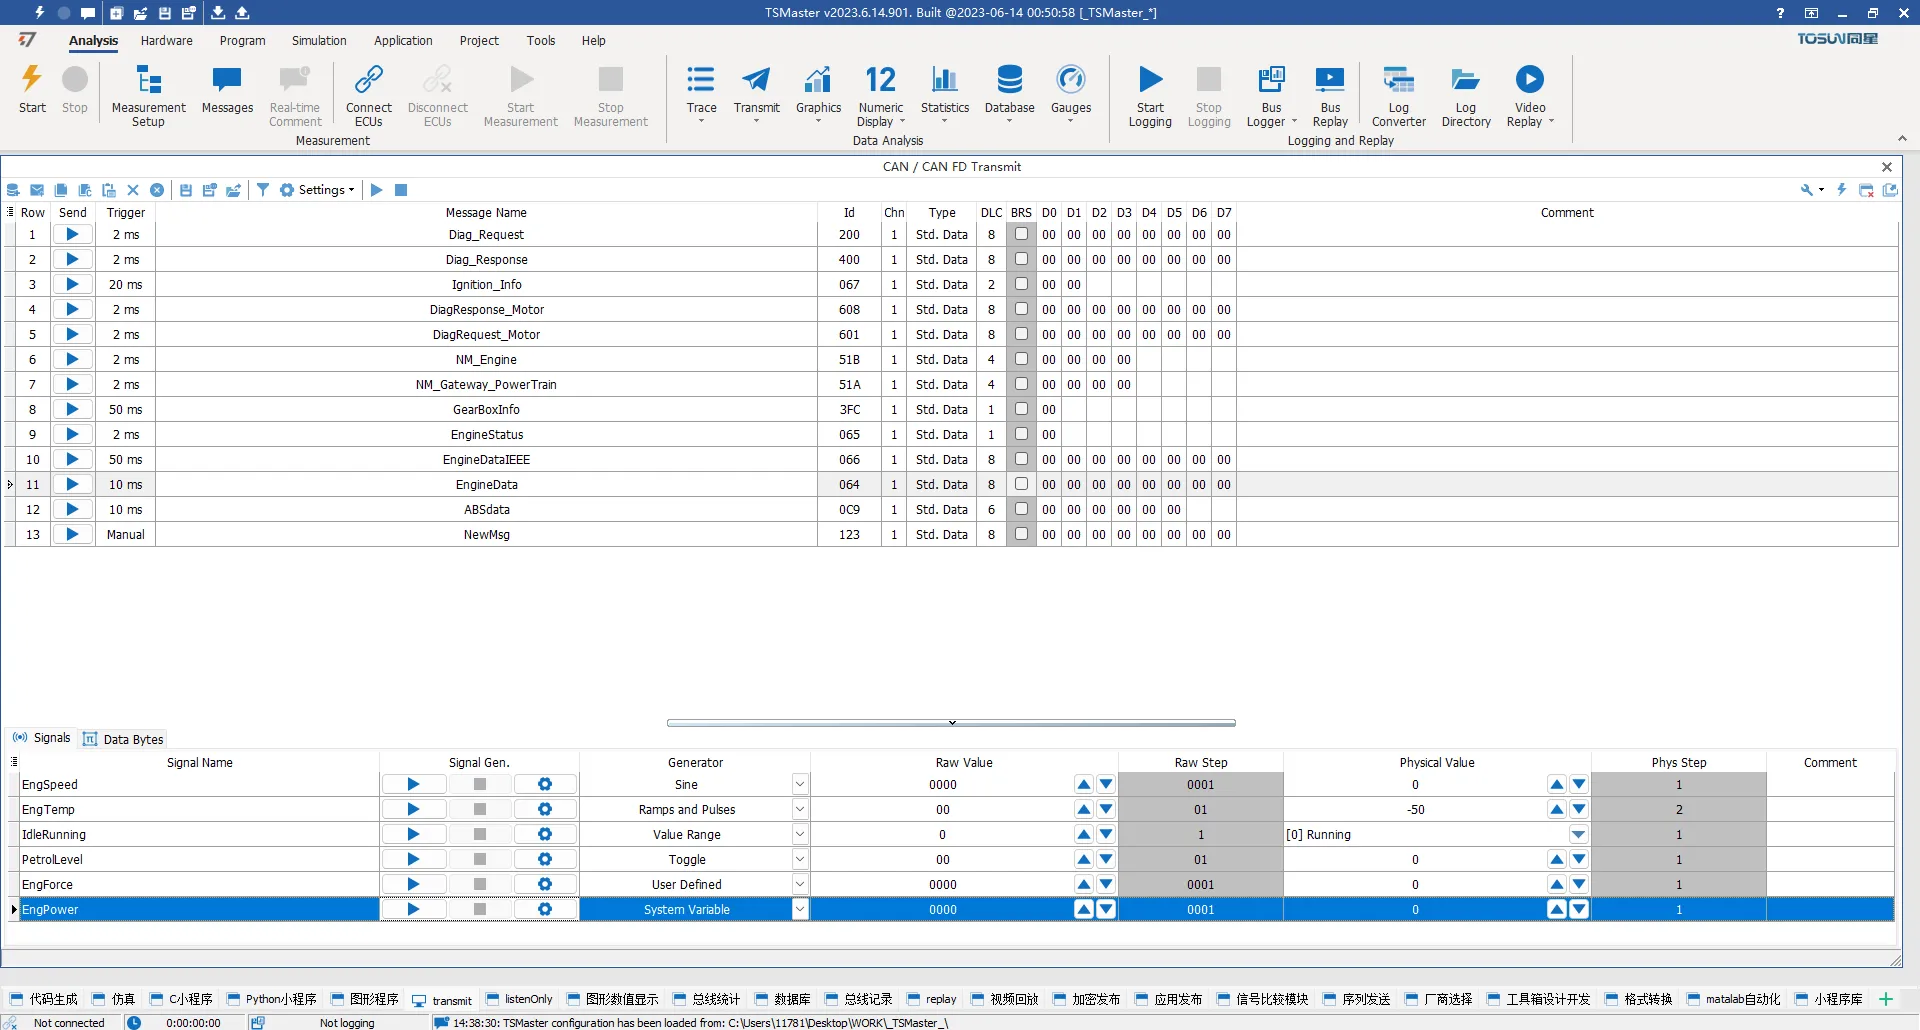
How can CAN messages be transmitted?
There are various methods to send CAN messages, including:
- Manual sending
- Shortcut key sending
- Periodic sending
- Adding custom messages and retrieving sending messages from the database
- CAN RBS simulation sending
- C script sending, which includes:
- Single-frame sending function
- Periodic sending function
- Sequence sending module
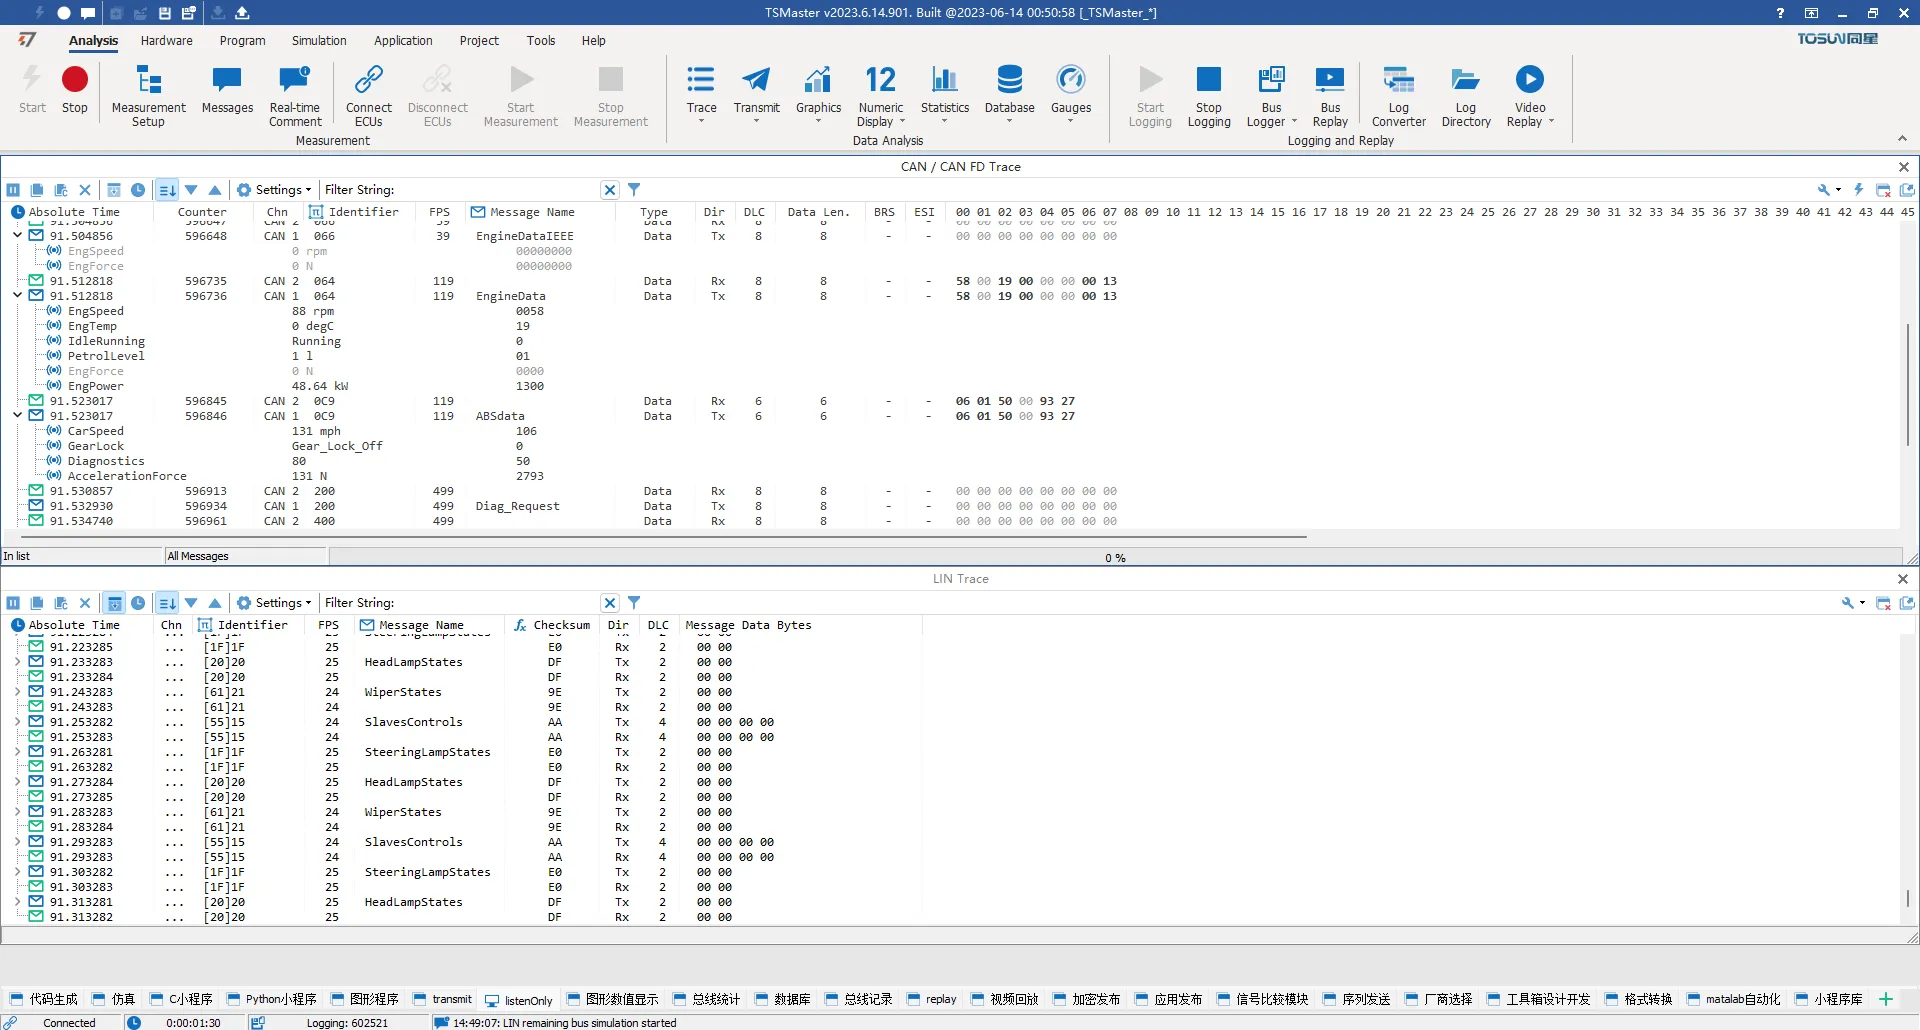
How can messages be filtered?
There are several methods for message filtering, including:
1. Message ID filtering
2. String filtering
3. Filter settings within measurements
4. Programmable filters
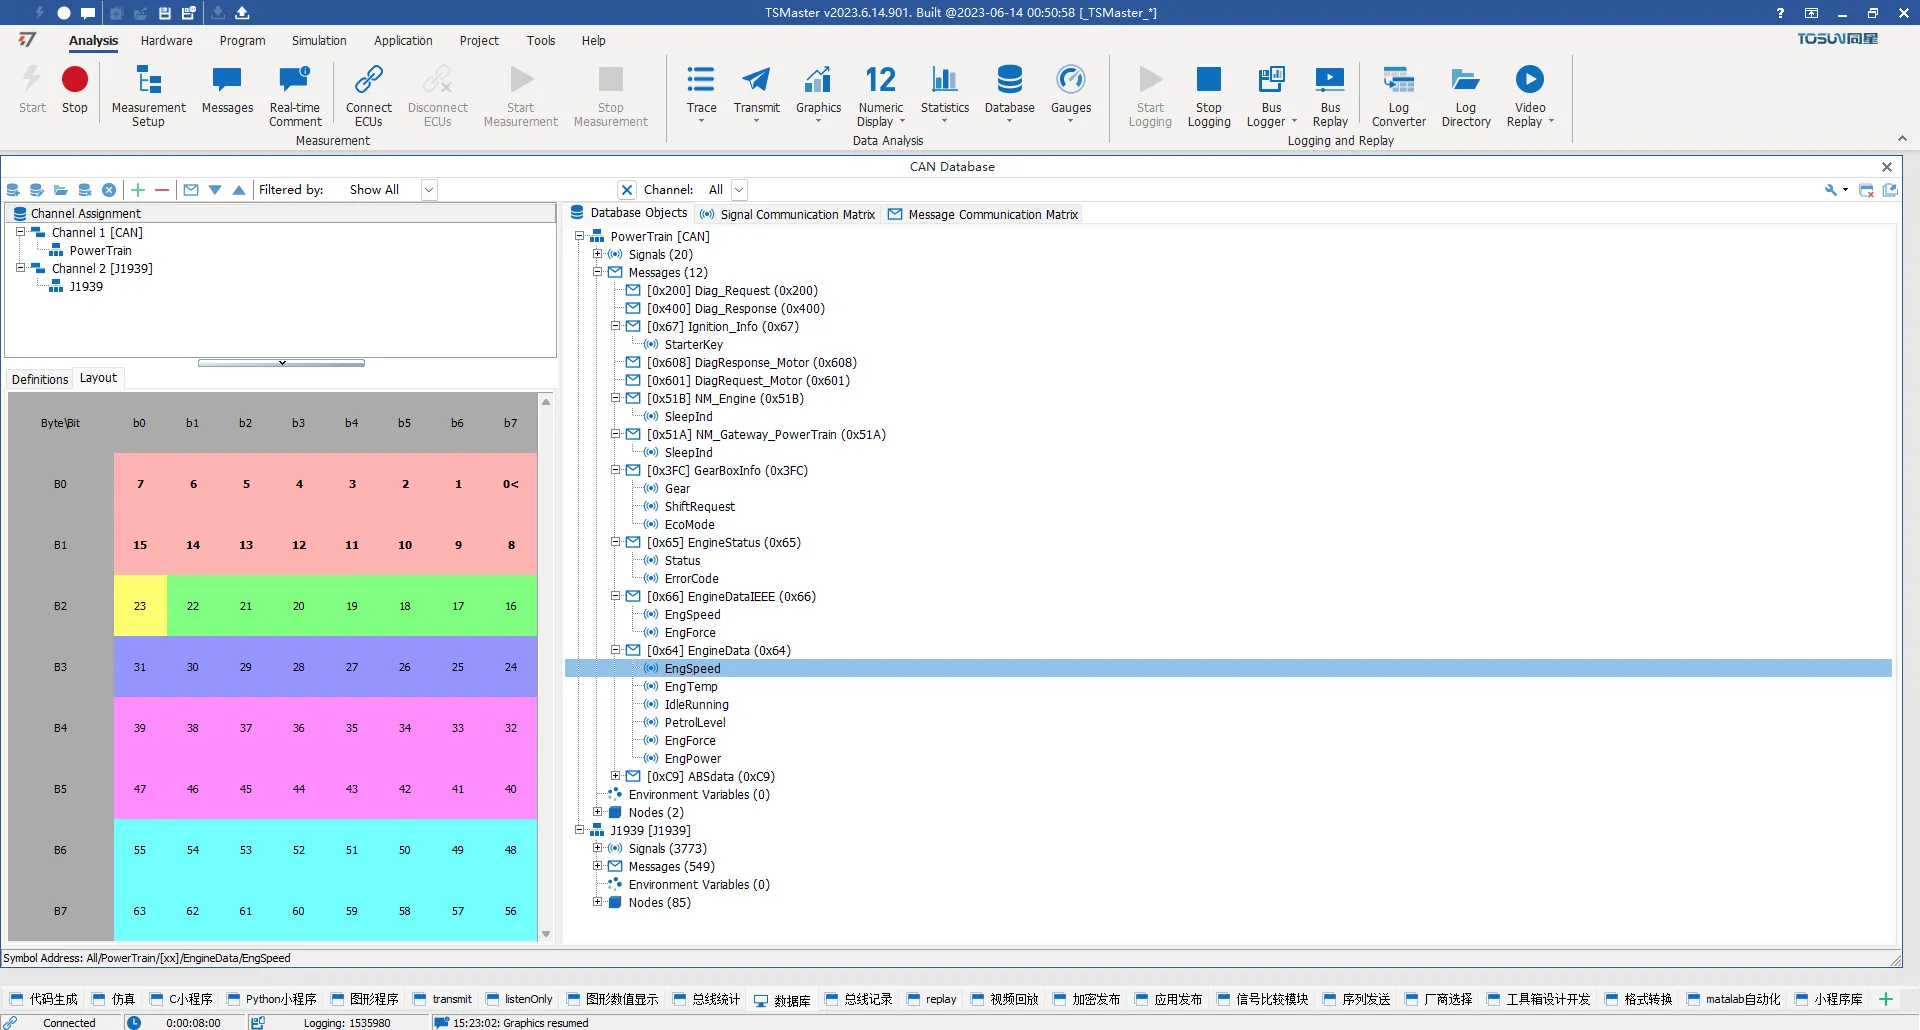
Why do the other three CAN channels loaded with individual DBC files on the same device disappear when reopening the software, leaving only the DBC of the first CAN channel saved?
The issue with only one DBC file being loaded by default for all four CAN channels was due to the customer using the same database network name for each channel. This resulted in a conflict where the software could only load one DBC file associated with that network name.
The problem was successfully resolved by modifying the network names for each CAN channel. By assigning unique network names to each channel, the software was able to differentiate between the DBC files and load them correctly, allowing for the intended functionality with multiple DBC files for different CAN channels.
What is the maximum delay time supported for LIN message sending?
The maximum supported time is 255ms, and this limitation is by design due to hardware constraints.
Does TSMaster support sending LIN error frames?
The active sending of error frames is a feature related to LIN interference, and it is currently not supported
What could be the reason for encountering an error when deploying a schedule table, while there are no errors when sending messages individually?
The verification algorithm in the node ECU contains an error, leading to a verification error when the schedule table is executed. This is an expected outcome. However, during single-frame message transmission, verification is intentionally not performed as part of the design, which is why no errors are triggered in that scenario.
What could be the cause of continuous FlexRay message errors and unable to communicate normally?
Continuous FlexRay message errors and the inability to communicate normally may be attributed to channel configuration issues. To address this, it is advisable to follow these steps:
Verify that there are at least two or more cold-start nodes within the network.
Ensure that there are no conflicting messages being sent between nodes.
These are among the most frequent causes of communication failures reported by most customers.
Why are the FlexRay signals not being received by the tested ECU or the entire vehicle, even though FlexRay communication is functioning normally, and the signals are being sent as expected?
There is a significant likelihood that this particular signal may require end-to-end (e2e) verification to ensure proper reception and functionality.
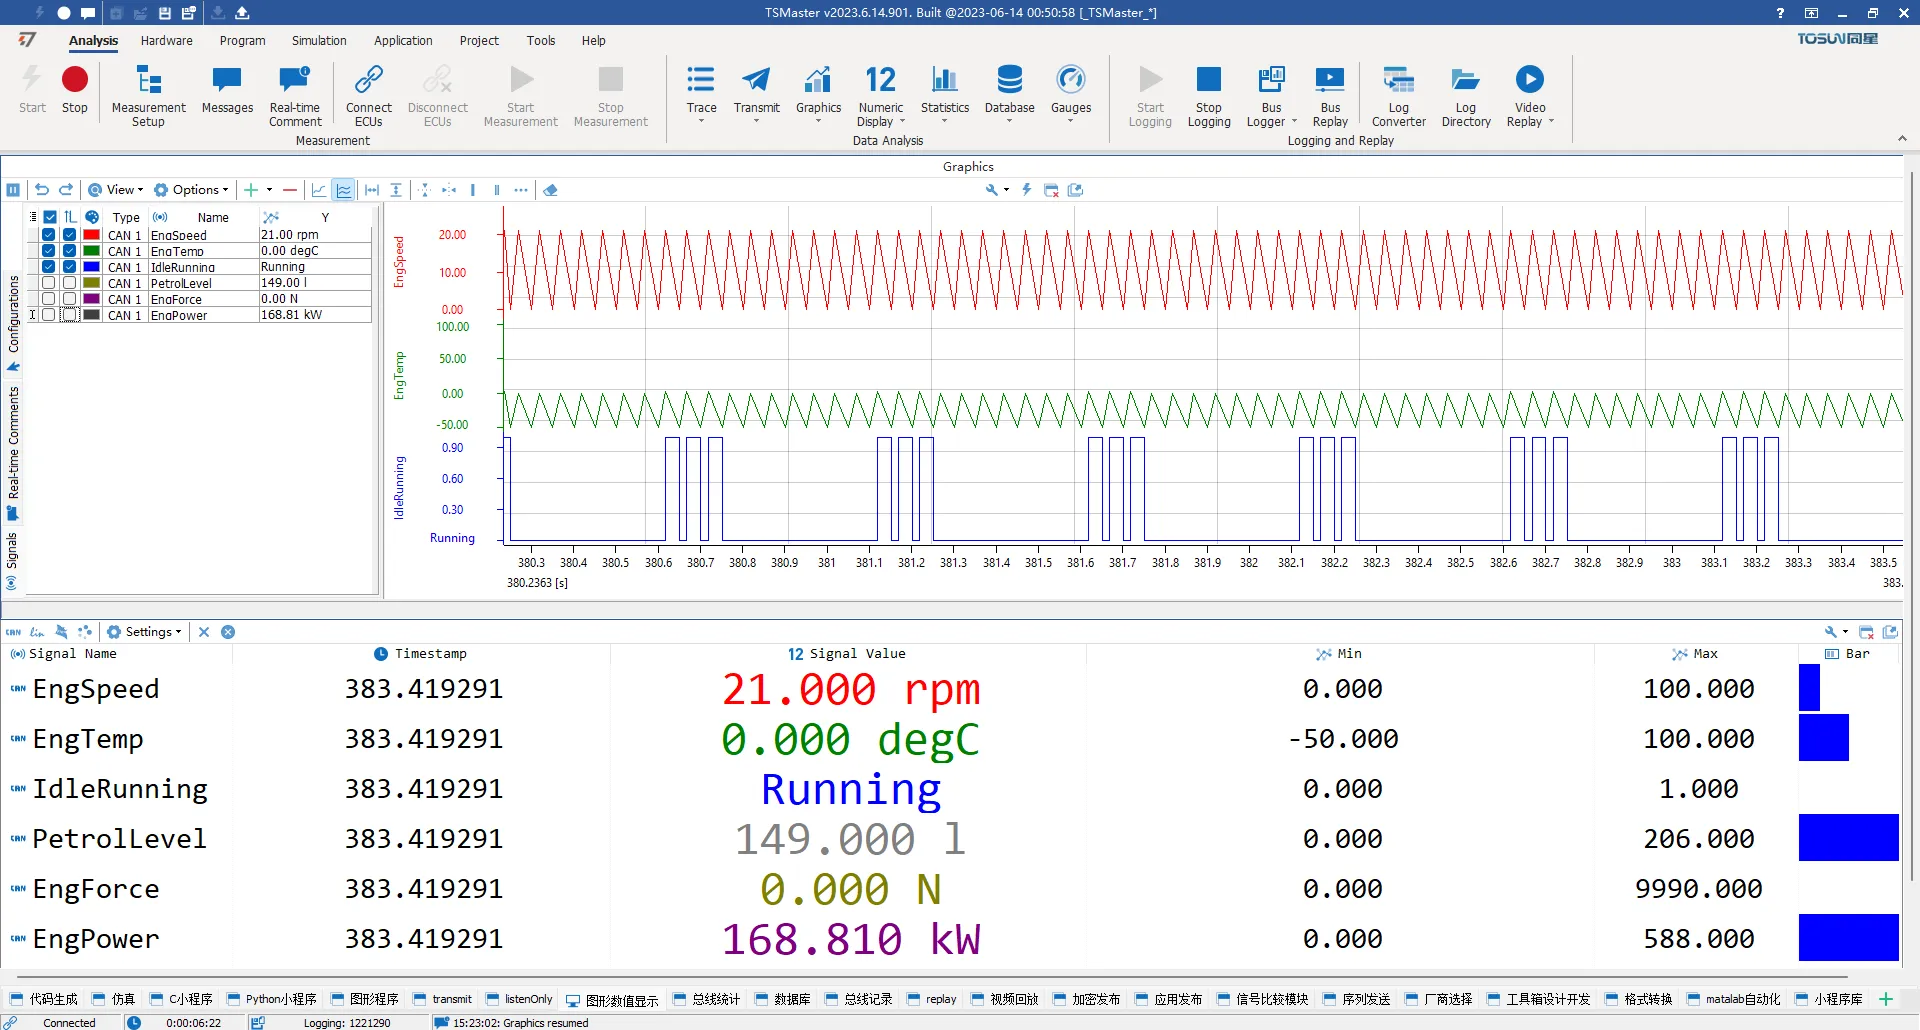
How to select and copy one or more signals in the graph to another graph window?
You can hold down the ‘shift’ or ‘ctrl’ key to select multiple signals and, while keeping the ‘shift’ or ‘ctrl’ key pressed, drag them to another graph window using the left mouse button.
Encounter an error when adding messages to the graph.
Reason: The graph cannot display the entire message; it can only show signals.
Solution:
- Add a custom signal to the graph.
- Input the message ID.
- Define the starting bit, length, amplification factor, etc., for the signal.


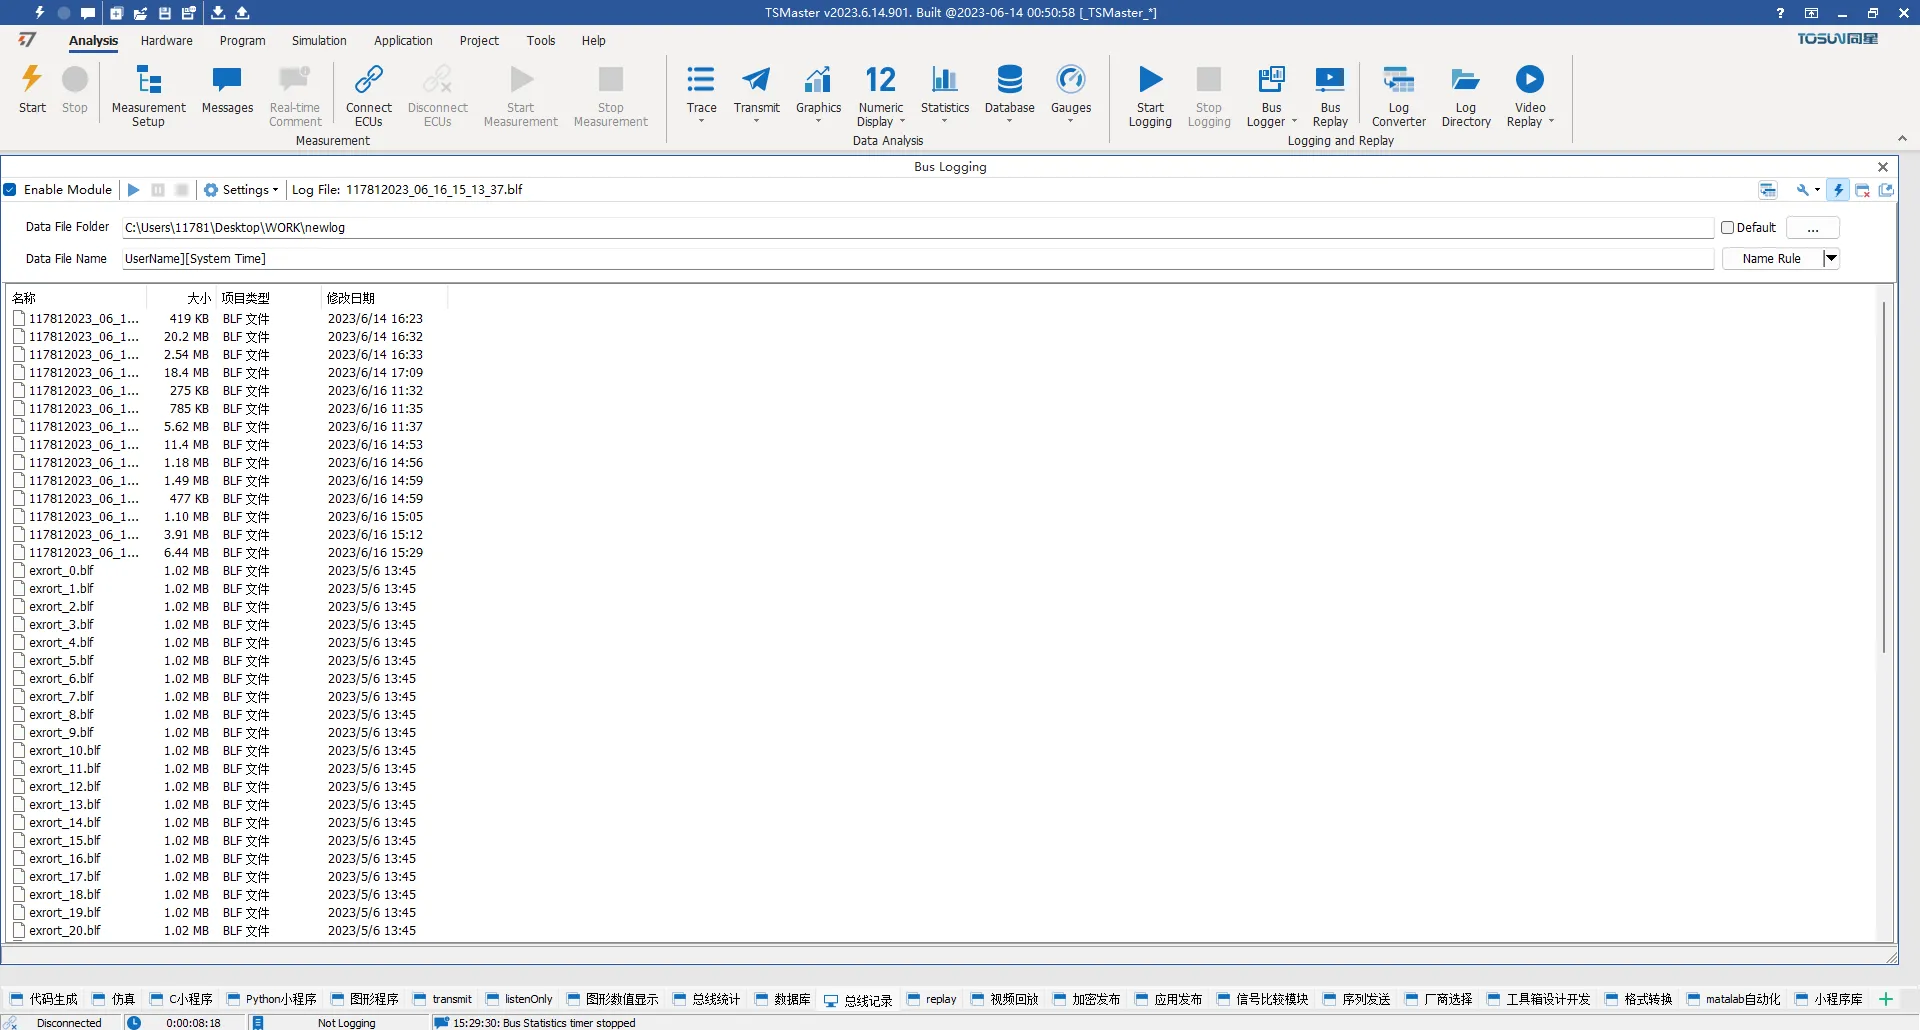
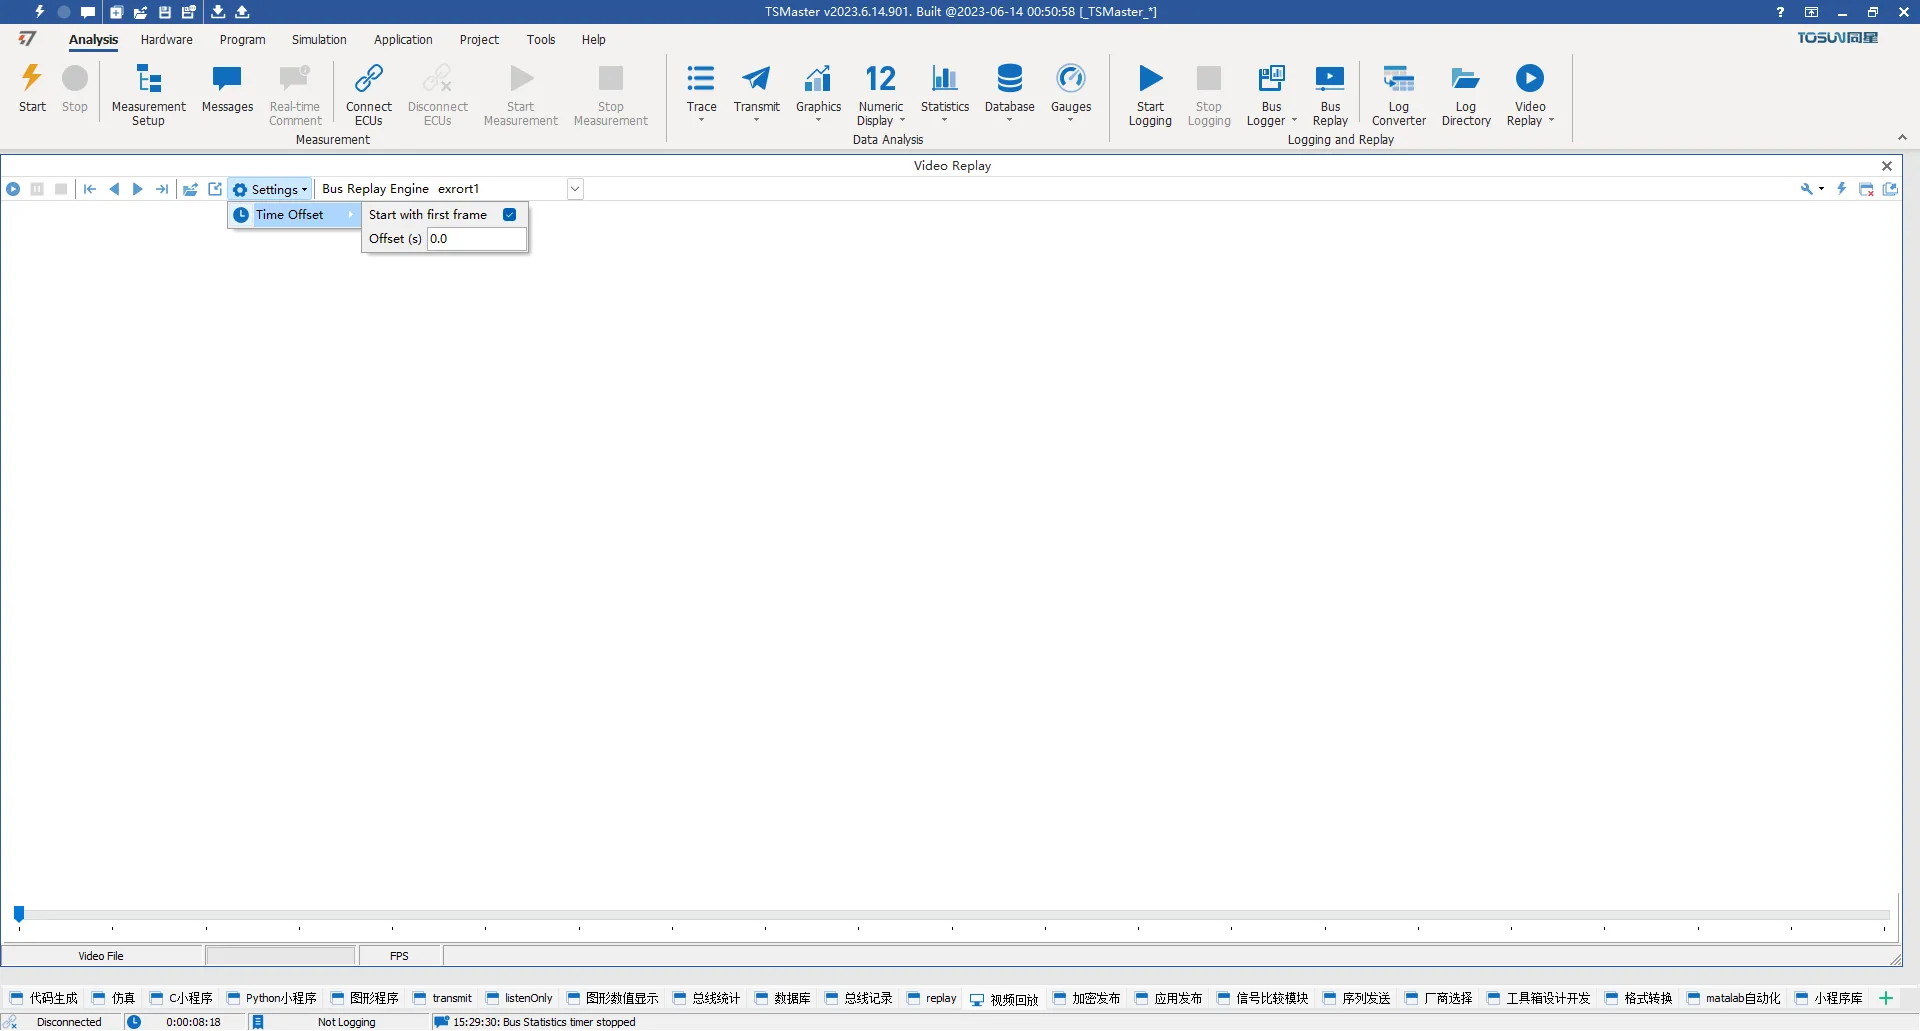
Can you replay the messages?
Yes. The bus playback window can replay CAN, CAN FD, LIN, FlexRay, and Automotive Ethernet messages from external log files in BLF file format. We provide both offline replay and online replay functions.